
Spatial autocorrelation measures spatial and attribute similarity in one metric. If something is spatially autocorrelated, it means that objects of similar attributes tend to cluster together in space. It looks at the spatial distribution of an attribute in a dataset and asks the question, “how likely is it that this attribute is randomly distributed over space?” If the answer is “not very likely”, then that attribute can be said to be spatially autocorrelated.
This is particularly interesting when looking at UFO reports because it can show us patterns in the characteristics of the reports irrespective of external variables such as population density or military activity. A high number of reports in one spot does not necessarily mean it is a hotspot if there are many different types of shapes reported in that location.
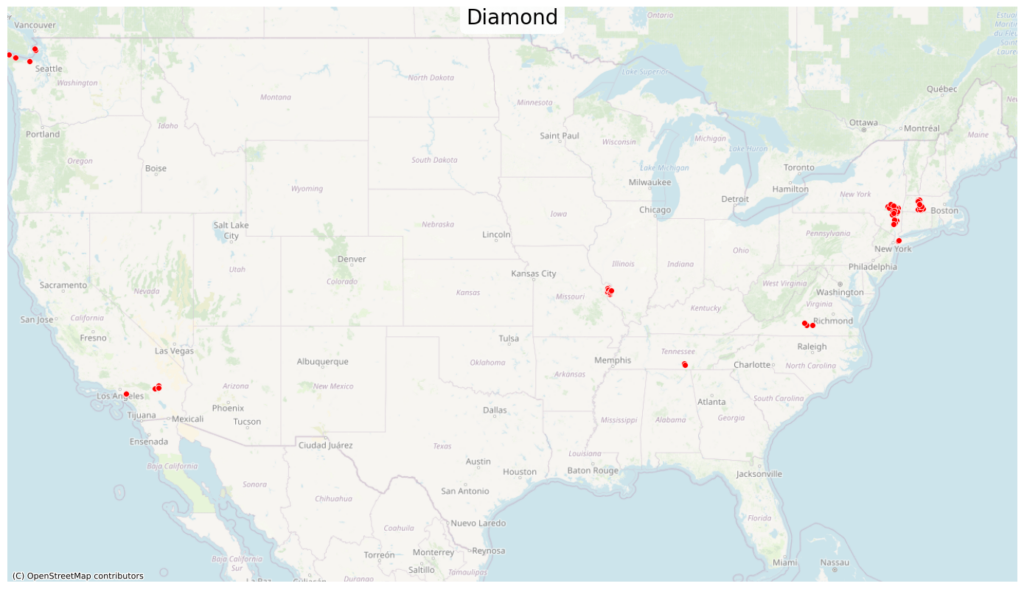
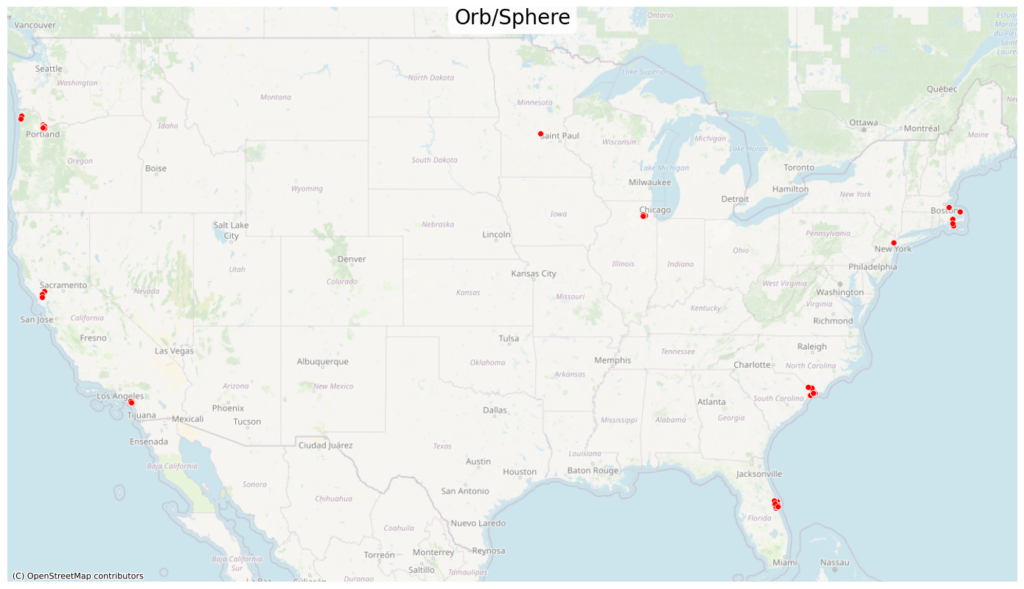
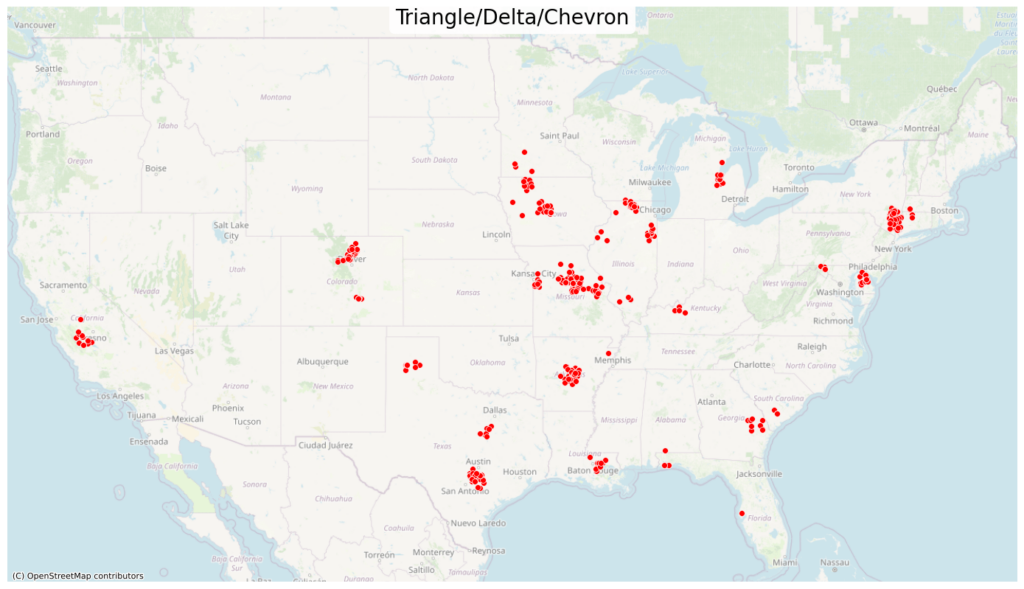
The question being asked here is summarized as the following – are there locations in the US where there are an unusually high number of reported shapes as compared to the rest of the country?
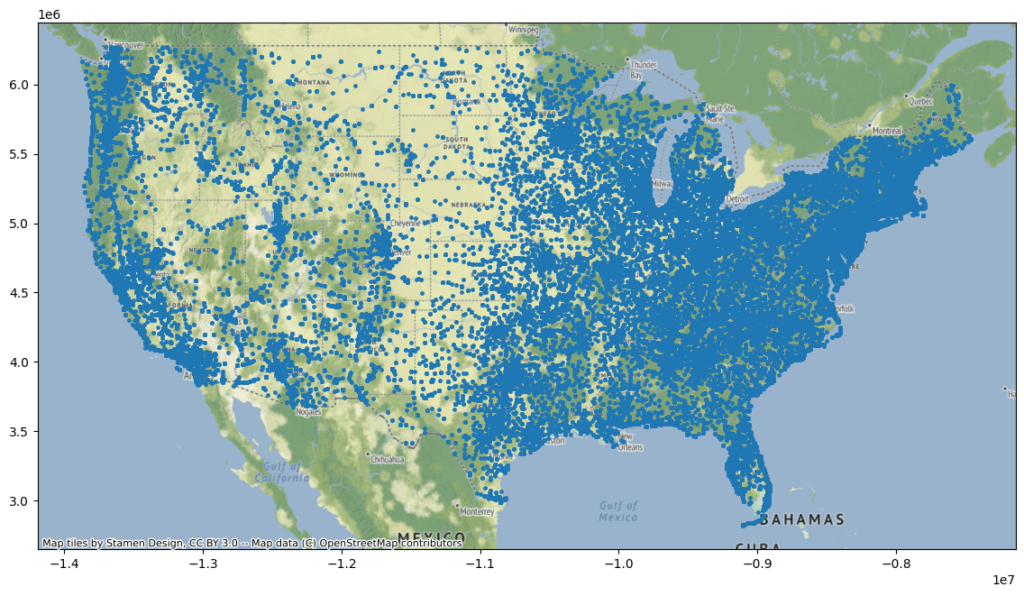
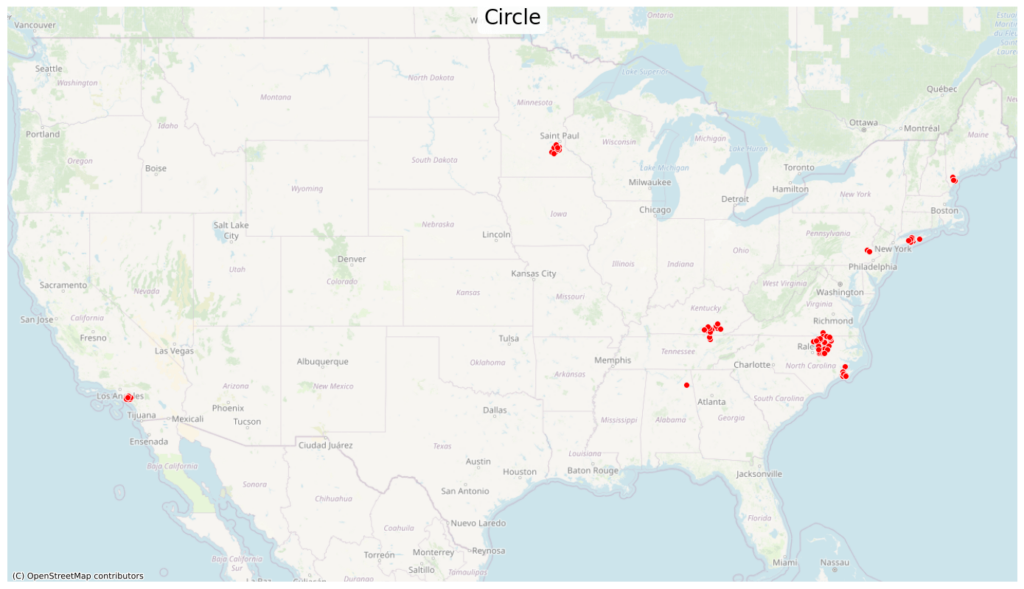
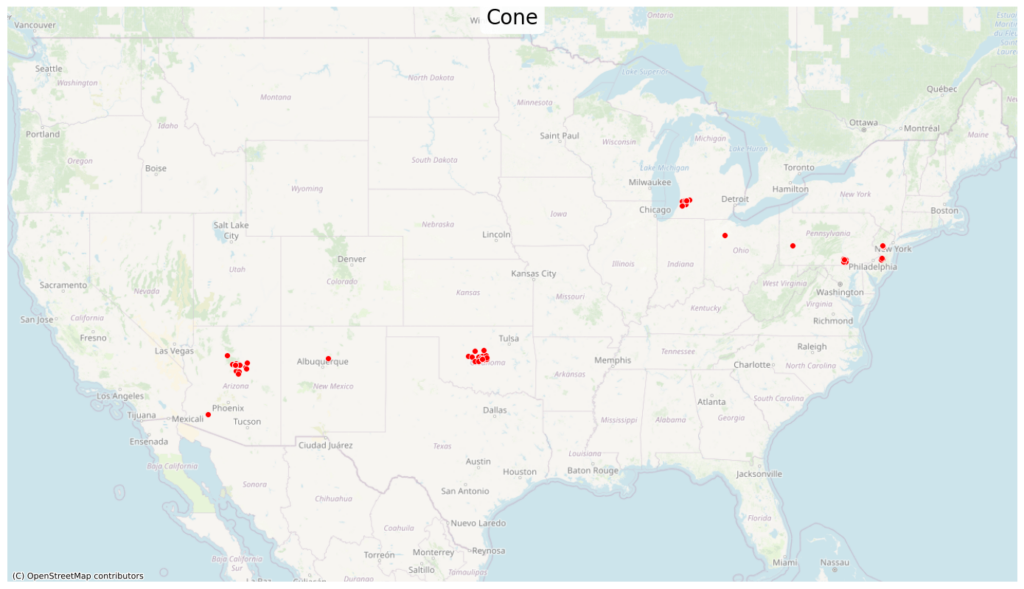
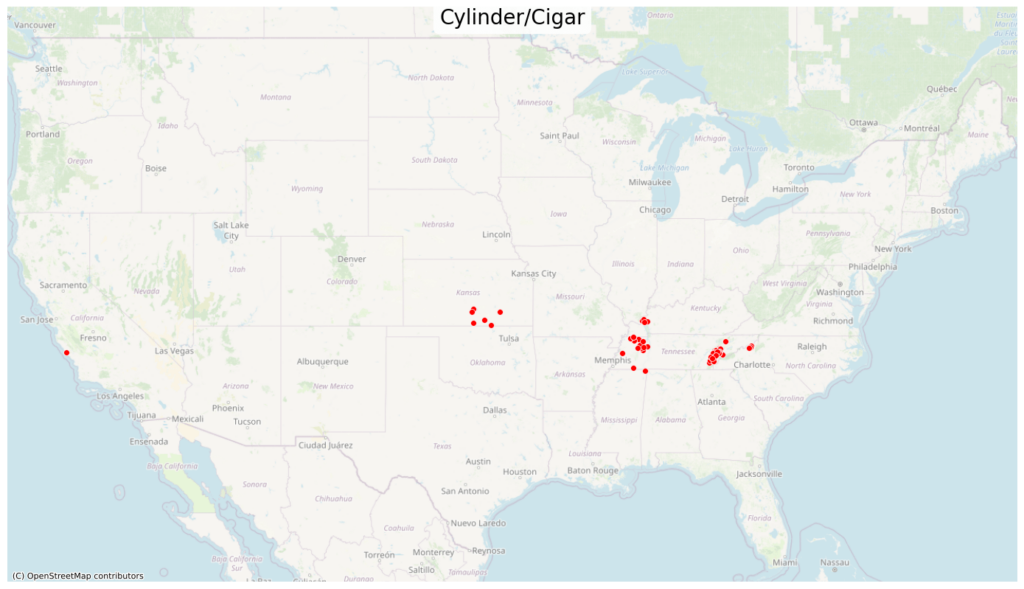
This analysis looks at ~120,000 reports in ~27,000 unique locations. The hotspots plotted on these maps are only the most significant with p <= 0.001.
INTERPRETATION OF RESULTS
Do the hotspots in the maps below show areas where there is concentrated activity of certain UFO types? Military tests? Experimental Boeing/Lockheed/Raytheon aircraft? Or dare I say it, aliens??? No. Well, maybe. All that we can say is that many people saw the same thing at the same location. This gives more credibility to these sightings and reduces the likelihood that these were hoaxes, hallucinations, or a mischaracterization.
Ultimately the point of this post is not to tell a compelling story or support one theory over another. We just want to let the data speak for itself and use this as a starting point for further characterization.
CREDITS
Our thanks go to Jacob Roush for preforming this analysis and authoring this study. You can read his original post on Reddit here.
ALL REPORTS
RESULTS


Source link
